At Ad Results Media, we are constantly looking for ways to optimize the performance of our clients. As our CEO Marshall Williams always says, “We need to treat our client’s budgets as if they were our own." That simple premise has instilled an insatiable desire to continuously strive to ensure that every dollar spent is done so with maximum efficiency.
In this month’s “Campaign Insights” article, we dive a bit deeper into two potential dimensions in gender distribution as we explore the relationship of gender skews related to campaign performance.
Dimensions:
- Gender distribution of the podcast audience
- Gender distribution of the client’s customer base
- Note: A future research project will also examine the gender of the podcast host on performance.
How We Did It
With data from over 100 clients, we have an extremely rich source of data that we constantly mine when gathering insights. To estimate the gender distribution of a client’s customer base, we have relied on data from Google Analytics. For the gender distribution of the podcast show’s audience, we have relied on survey data from our network partners.
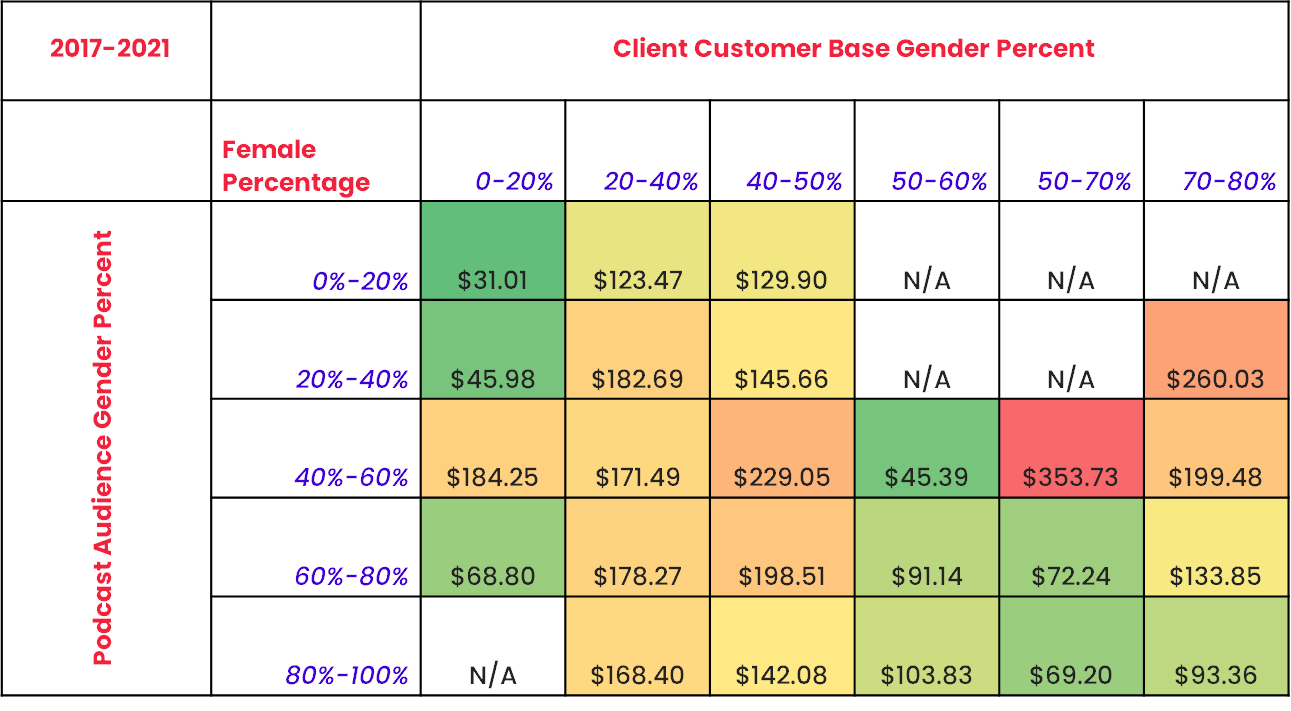
To normalize data across clients with different goals, we have taken every client’s key performance indicator (KPI) (i.e. Cost Per Install, Cost Per Sale, Cost Per Download, etc…) and treated them as if every client had a KPI goal of $100. So, the way to read the chart below is that everything under $100 is beating target, and everything above $100 is missing target.
The data period for this chart is 2017 to current. The columns represent the percentage of a client’s female customer base, and the rows represent the percentage of the show’s female audience. For example, the cell that contains “31.01” is referring to a client with a low female customer base (predominately male) who advertised on podcasts that had a low female audience (predominately male). The opposite can be said for the cell that contains “93.36”.
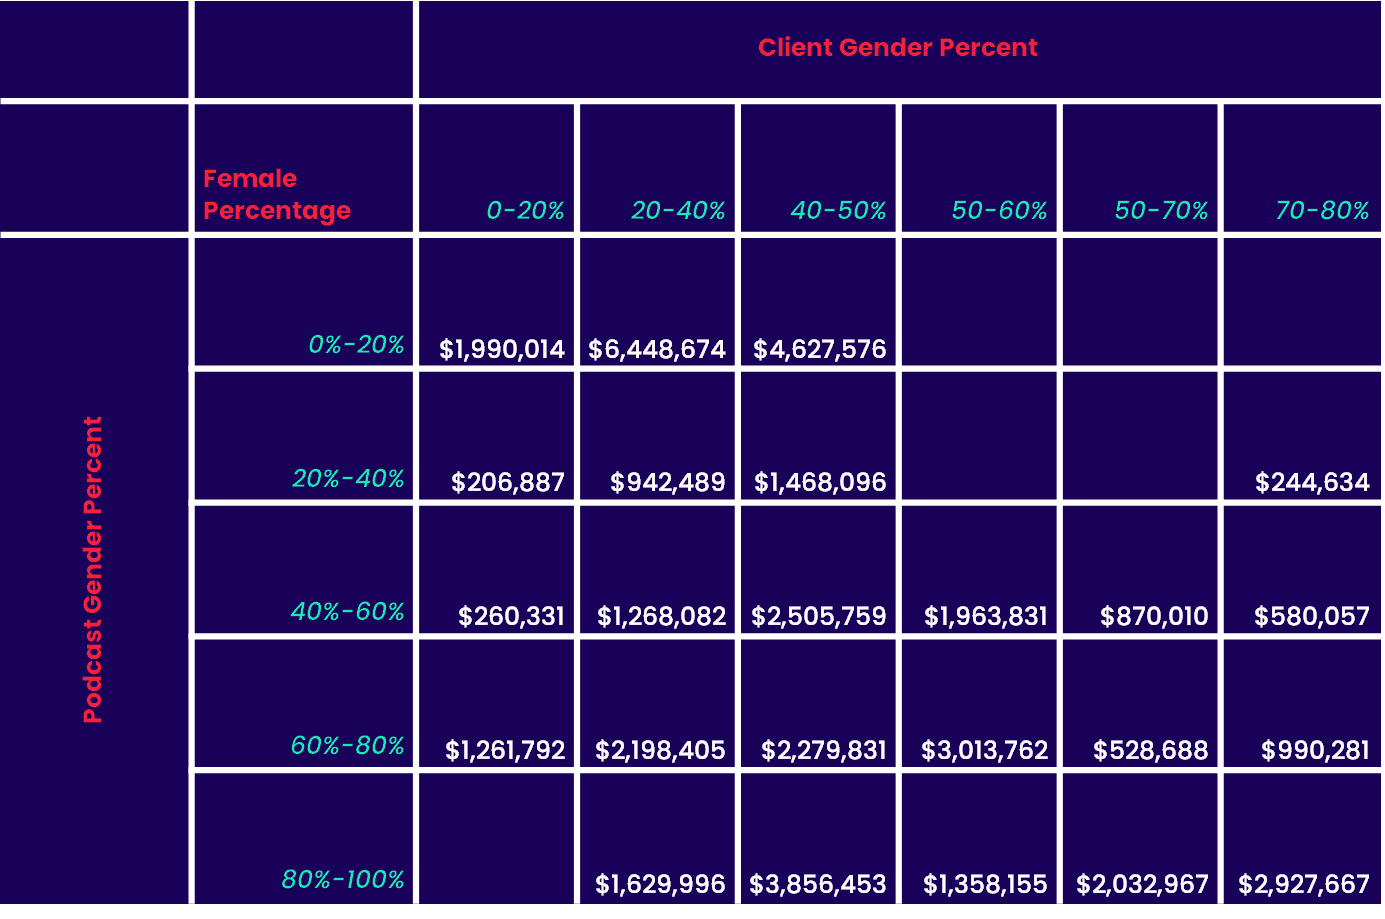
- Note 1: We only included cells with at least $100K in spend to account for potential sample size issues, and we have included an appendix that shows the amount of spend per cell to further understand these concerns.
- Note 2: We were also careful to account for other factors including underlying show growth, CPM, and seasonality.
What We Found

When you examine the chart, it seems clear that gender skews can be a powerful determinant of performance. Specifically at the very tail ends, for heavily female shows with a heavily female customer base and vice-versa with male-heavy shows with a heavily male customer base.
We tend to see our best performance in those cells. Which seems very commonsensical. After all, a brand like Roman, which markets products for males, would likely not achieve overwhelmingly positive results if they were advertising on a show with mostly female listeners.
Gender distribution is one of the many data considerations our account teams leverage when putting together a deep, balanced, and custom media plan for our clients as it creates a good argument for the use of potentially infusing programmatic solutions into your media plan. Programmatic buying may be a good way to purchase only the specific gender population for specific gender-skewing clients could potentially lead to very positive outcomes.
Appendix


